The Calculation Formula in the MRP Module
The core of the MRP module is the formula that calculates the quantities in Production and Purchase Order Plans. These are the quantities of each Item that you need to produce or purchase in order to meet Sales Forecasts and, if you are using Stock Policies, to ensure the required quantity of each Item remains in stock at the end of each week or month.If you have included Items that you need to produce (using Productions) in your Sales Forecasts, the formula will be used by the Create Production Plan - Preview report and the 'Create Production Plan' Maintenance function to calculate the quantity of each Item that you need to produce in each week or month. Please refer here for more details and an example.
If you have included Items that you need to purchase for resale in your Sales Forecasts, the formula will be used by the Create Purchase Order Plan - Preview report and the 'Create Purchase Order Plan' Maintenance function to calculate the quantity of each Item that you need to purchase in each week or month. This will include calculating the quantities of components that you need to purchase in order to produce the Items in Production Plans. This requires that you run the 'Create Production Plan' Maintenance function for a particular period and mark the resulting Production Plan(s) as OK before running the 'Create Purchase Order Plan' function. Please refer here for more details and an example.
The formula will calculate weekly or monthly figures depending on the Period Type that you have specified in the Forecast Settings setting.
---
The Calculation Formula in the MRP module:
- Introduction
- The Production Plan Formula
- The Purchase Order Plan Formula
- Stock Policy - Average Sales per Day
- Dates and Workflow
- Start Dates in Production Plans
- Order Dates in Purchase Order Plans
- Home page for MRP manual
- Home page for Standard ERP manual
The Production Plan Formula
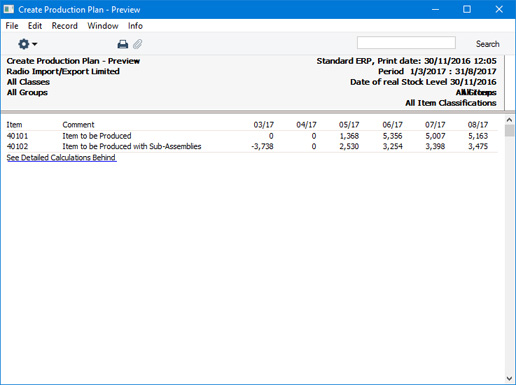
This section describes the formula that the 'Create Production Plan' Maintenance function will use to calculate the quantities in Production Plans. These are the quantities of each Item that you need to produce in order to meet Sales Forecasts and, if you are using Stock Policies, to ensure the required quantity of each Item remains in stock at the end of each week or month.Before using the Maintenance function to create a Production Plan, you can produce a Create Production Plan - Preview report to see a list of the Items that will be included in the Production Plan together with quantities. In the report there will be a [See Detailed Calculations Behind] text button: click (Windows/Mac OS X) or tap (iOS/Android) this button to open a more detailed report showing how the formula was used to calculate each quantity. Each step in the calculation will be shown.
Illustrated below is an example 'Create Production Plan - Preview' report:
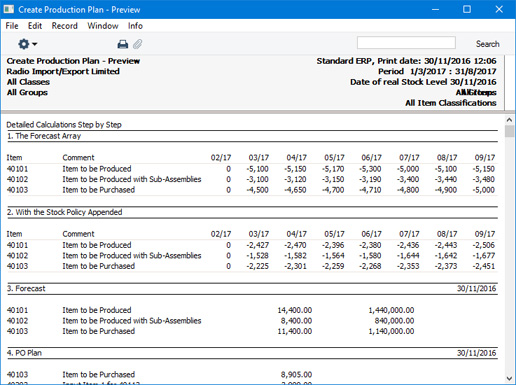
- Step 1: The Forecast Array
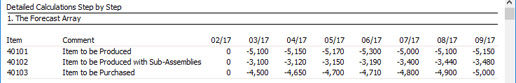
- The first stage in the calculation is to establish the sales forecast figures for each Item. These are taken from records in the Sales Forecast register that have been marked as OK.
- In the detailed report, this section will include a column for the week or month after the report period (space allowing).
- If you need a report that only shows these figures, use the Basic Item Requirements report.
- The first stage in the calculation is to establish the sales forecast figures for each Item. These are taken from records in the Sales Forecast register that have been marked as OK.
- Step 2: With the Stock Policy Appended
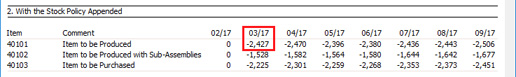
- The Stock Policies setting contains minimum and maximum start-of-period stock levels for each Item, expressed as a number of days' sales. This step in the calculation formula uses that setting and the sales forecast figures to calculate the quantity of each Item that you should have in stock at the beginning of each week or month. When you produce the report or run the Maintenance function, you will be able to specify whether this calculation will use the minimum or maximum stock level in the setting. Please refer to the Stock Policy - Average Sales per Day page for details about this calculation.
- If an Item has no Stock Policy, it will be assumed that the stock level should be zero at the beginning of each week or month (i.e. having no Stock Policy and having a Stock Policy with zero values amount to the same thing).
- If you choose "Neither" as the Stock Policy in the specification window when printing the report or running the Maintenance function it will be assumed that the stock level at the beginning of a week or month should be the full Sales Forecast figure for that week or month. In this case, this step will not be shown in the report, but the figures will be visible in step 10.
- Referring to the illustration above, the figure for Item 40101 for March is -2427. This means that there should be 2427 units in stock at the beginning of March.
- If you need a report that only shows these figures, use the Stock Levels based on Stock Policy report.
- The Stock Policies setting contains minimum and maximum start-of-period stock levels for each Item, expressed as a number of days' sales. This step in the calculation formula uses that setting and the sales forecast figures to calculate the quantity of each Item that you should have in stock at the beginning of each week or month. When you produce the report or run the Maintenance function, you will be able to specify whether this calculation will use the minimum or maximum stock level in the setting. Please refer to the Stock Policy - Average Sales per Day page for details about this calculation.
- Steps 3-6
- When you produce the report or run the Maintenance function, you might not know the exact stock level of each Item at the beginning of the period, probably because you are producing the report or running the Maintenance function ahead of time. You will therefore need to specify the date when you know the stock figures to be accurate (the "Date of Real Stock Level"). If the Date of Real Stock Level is earlier than the beginning of the period, the calculation formula will estimate stock levels on that date using the relevant Sales Forecast, Production and Purchase Order Plan figures. Steps 3-6 represent this part of the calculation.
- For example, the report period begins on March 1st, and you know that stock level figures are correct on the date when you are running the report, the previous November 30. Enter this date as the Date of Real Stock Level in the report specification window. The report will estimate stock levels for March 1st, displaying the calculation in sections 3-6 as follows:
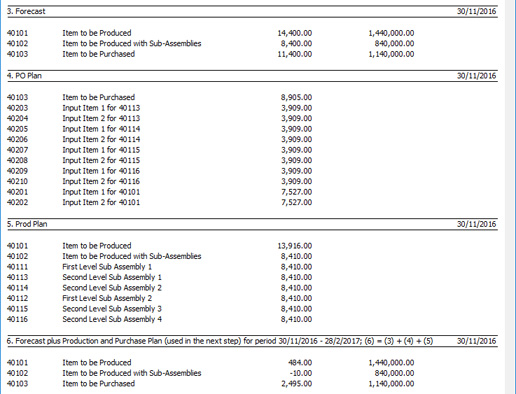
- Step 3: Forecast
- Estimated sales figures for November 30 - February 28 (February 29 in a leap year), calculated using the Sales Forecast records for November - February.
- Step 4: PO Plan
- Estimated goods-in figures for November 30 - February 28, calculated using the Purchase Order Plan records for November - February.
- Step 5: Prod Plan
- Estimated production figures for November 30 - February 28, calculated using the Production Plan records for November - February.
- Step 6: Forecast plus Production and Purchase Plan
- Step 3 - Step 4 - Step 5 (i.e. the net change in stock levels for the period November 30 - February 28 (or 29)).
- When you produce the report or run the Maintenance function, you might not know the exact stock level of each Item at the beginning of the period, probably because you are producing the report or running the Maintenance function ahead of time. You will therefore need to specify the date when you know the stock figures to be accurate (the "Date of Real Stock Level"). If the Date of Real Stock Level is earlier than the beginning of the period, the calculation formula will estimate stock levels on that date using the relevant Sales Forecast, Production and Purchase Order Plan figures. Steps 3-6 represent this part of the calculation.
- Step 7: Current Stock
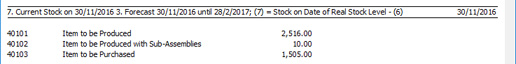
- The actual or calculated stock level of each Item at the beginning of the report period. This is calculated as the stock level on the Date of Real Stock Level less the figure in Step 6.
- The actual or calculated stock level of each Item at the beginning of the report period. This is calculated as the stock level on the Date of Real Stock Level less the figure in Step 6.
- Step 8: With the Stock Level and Forecast Appended
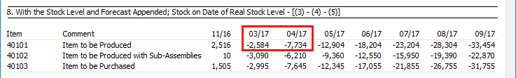
- This step calculates the stock level at the end of each week or month by subtracting the Sales Forecast for that week or month from the stock level at the beginning of that week or month. In other words, it is the quantity that needs to be produced to satisfy the Sales Forecast.
- In the example illustrated above, the figure for March for Item 40101 is -2584 (i.e. the stock level at the beginning of the report period (2516 from Step 7) less the Sales Forecast (5100)). The April calculation begins with the -2584 figure (stock level at the end of March) and subtracts the April sales forecast of 5150, producing -7734. This is shown as a negative figure, indicating that the Sales Forecast figure cannot be met from stock.
- This step calculates the stock level at the end of each week or month by subtracting the Sales Forecast for that week or month from the stock level at the beginning of that week or month. In other words, it is the quantity that needs to be produced to satisfy the Sales Forecast.
- Step 9: Next calculation will take Projected Stock Levels from Previous Month
Reprints step 8.
- Step 10: Minus: Stock Policy for next month
Reprints step 2.
- Step 11: Minus: Forecast of this month, resulting in:
- Step 10: Minus: Stock Policy for next month
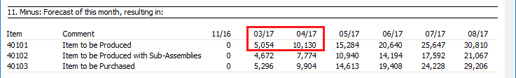
- This step calculates the quantity of each Item that you need to produce to meet both the Sales Forecast for the week or month and the Stock Policy requirement for the next week or month. It subtracts the Stock Policy requirement for the next week or month from the Step 8 figure for the week or month.
- In the example illustrated above, the Stock Policy requirement of Item 40101 for April is 2470 (from Step 2). This means there should be a quantity of 2470 in stock at the beginning of April. At the beginning of March, the stock level is 2516, and March's Sales Forecast is 5100. It is therefore necessary to produce 5054 (2470 - 2516 + 5100) to meet this target.
- Continuing the example, the Stock Policy requirement of Item 40101 for May is 2396 (from Step 2). This means there should be a quantity of 2396 in stock at the beginning of May. At the beginning of April, the stock level will theoretically be 2470 (from the Stock Policy for April), and April's Sales Forecast is 5150. It is therefore necessary to produce 5076 (2396 - 2470 + 5150) to meet this target. The figures in section 11 are accumulated: 5054 + 5076 = 10130.
- If this figure is negative, this indicates that the Sales Forecast and the Stock Policy requirement for the next week or month can be met from stock and therefore there is no production requirement. The Item will then not be included in the Production Plan for the week or month by the 'Create Production Plan' Maintenance function.
- This step calculates the quantity of each Item that you need to produce to meet both the Sales Forecast for the week or month and the Stock Policy requirement for the next week or month. It subtracts the Stock Policy requirement for the next week or month from the Step 8 figure for the week or month.
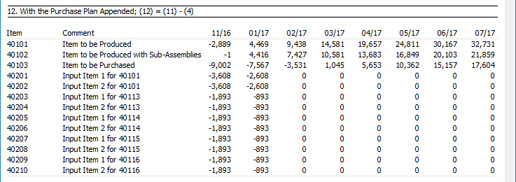
- Step 12: With the Purchase Plan Appended
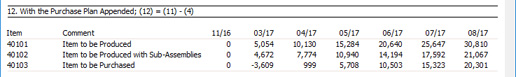
- If you have already created and marked as OK a Purchase Order Plan for a week or month, this step will subtract the quantities in that Purchase Order Plan from the figures in Step 11.
- Usually the existence of a Purchase Order Plan will not affect the quantities in a Production Plan. It will only do so if you have decided to purchase Items that you normally produce.
- If you have already created and marked as OK a Purchase Order Plan for a week or month, this step will subtract the quantities in that Purchase Order Plan from the figures in Step 11.
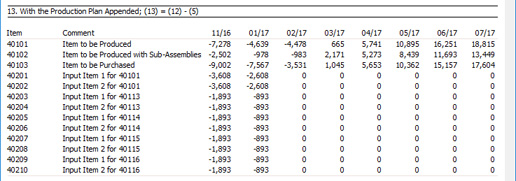
- Section 13: With the Production Plan Appended
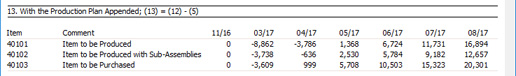
- If you have already created and marked as OK a Production Plan for a week or month, this step will subtract the quantities in that Production Plan from the figures in Step 12.
- This suggests that running the 'Create Production Plan' Maintenance function again will create a second Production Plan for the same Items for the week or month in question, effectively creating a supplement to the original Production Plan. In fact the Maintenance function will mark the original Production Plan as Closed and will create a new Production Plan for the entire requirement (providing no Productions or Production Orders have been created from the original Production Plan: if they have, the Maintenance function will do nothing).
- If you have already created and marked as OK a Production Plan for a week or month, this step will subtract the quantities in that Production Plan from the figures in Step 12.
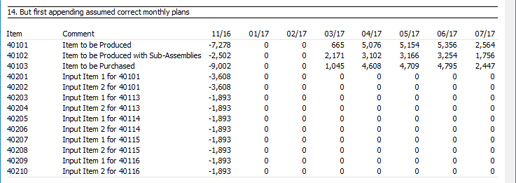
- Section 14: But first appending assumed correct monthly plans
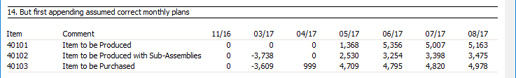
- Steps 8-13 in the report will display accumulated figures from period to period (i.e. from column to column). These figures are the accumulated effect on stock levels of the Sales Forecasts and the Stock Policy requirements.
- Step 14 separates the accumulated figures into individual weekly or monthly production and purchasing requirements. Negative figures in Step 13 will be set to zero: negative figures indicate requirements that can be satisfied from stock or from existing Production or Purchase Order Plans. Where the quantity is zero, the 'Create Production Plan' Maintenance function will not include the Item in the Production Plan for the week or month.
- Steps 8-13 in the report will display accumulated figures from period to period (i.e. from column to column). These figures are the accumulated effect on stock levels of the Sales Forecasts and the Stock Policy requirements.
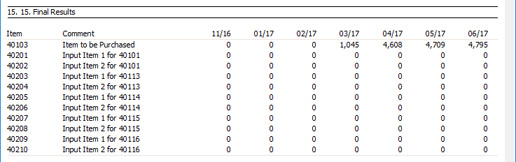
- Step 15: Final Results
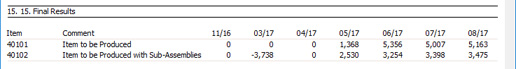
- This step shows the quantity of each Item that you need to produce.
- While the previous steps were calculated for every Item in Sales Forecasts, this step will isolate those that can be produced (i.e. those that have Recipes) from those that will be purchased.
- This step shows the quantity of each Item that you need to produce.
The Calculation Formula in the MRP module:
- Introduction
- The Production Plan Formula
- The Purchase Order Plan Formula
- Stock Policy - Average Sales per Day
- Dates and Workflow
- Start Dates in Production Plans
- Order Dates in Purchase Order Plans
- Home page for MRP manual
- Home page for Standard ERP manual
The Purchase Order Plan Formula
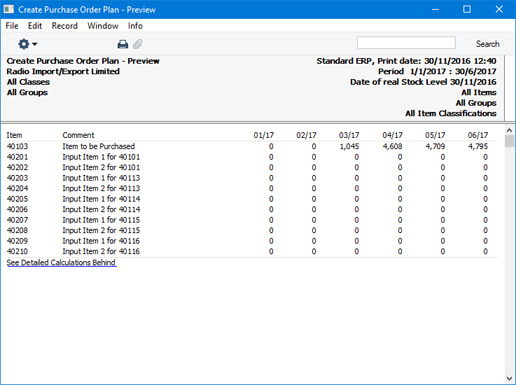
This page describes the formula that the 'Create Purchase Order Plan' Maintenance function will use to calculate the quantities in Purchase Order Plans. These are the quantities of each Item that you need to purchase in order to meet Sales Forecasts and, if you are using Stock Policies, to ensure the required quantity of each Item remains in stock at the end of each week or month.Before using the Maintenance function to create a Purchase Order Plan, you can produce a Create Purchase Order Plan - Preview report to see a list of the Items that will be included in the Purchase Order Plan together with quantities. In the report there will be a [See Detailed Calculations Behind] text button: click (Windows/Mac OS X) or tap (iOS/Android) this button to open a more detailed report showing how the formula was used to calculate each quantity. Each step in the calculation will be shown.
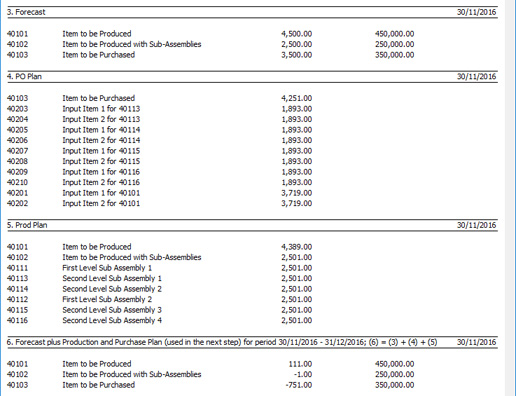
Illustrated below is an example 'Create Purchase Order Plan - Preview' report:
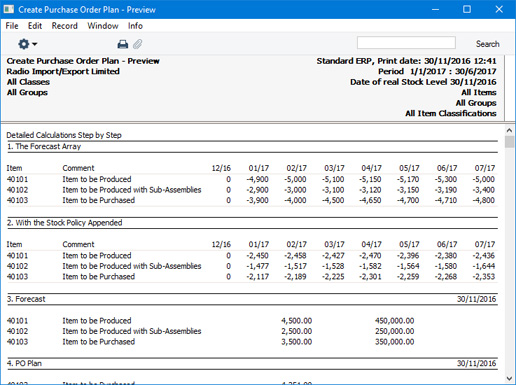
- Step 1: The Forecast Array
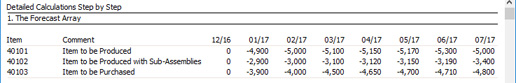
- The first stage in the calculation is to establish the sales forecast figures for each Item. These are taken from records in the Sales Forecast register that have been marked as OK.
- In the detailed report, this section will include a column for the week or month after the report period (space allowing).
- If you need a report that only shows these figures, use the Basic Item Requirements report.
- The first stage in the calculation is to establish the sales forecast figures for each Item. These are taken from records in the Sales Forecast register that have been marked as OK.
- Step 2: With the Stock Policy Appended
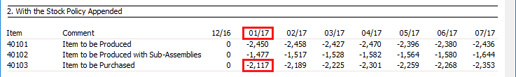
- The Stock Policies setting contains minimum and maximum start-of-period stock levels for each Item, expressed as a number of days' sales. This step in the calculation formula uses that setting and the sales forecast figures to calculate the quantity of each Item that you should have in stock at the beginning of each week or month. When you produce the report or run the Maintenance function, you will be able to specify whether this calculation will use the minimum or maximum stock level in the setting. Please refer to the Stock Policy - Average Sales per Day page for details about this calculation.
- If an Item has no Stock Policy, it will be assumed that the stock level should be zero at the beginning of each week or month (i.e. having no Stock Policy and having a Stock Policy with zero values amount to the same thing).
- If you choose "Neither" as the Stock Policy in the specification window when printing the report or running the Maintenance function it will be assumed that the stock level at the beginning of a week or month should be the full Sales Forecast figure for that week or month. In this case, this step will not be shown in the report.
- Referring to the illustration above, the figure for Item 40103 for January is -2117. This means that there should be 2117 units in stock at the beginning of January.
- If you need a report that only shows these figures, use the Stock Levels based on Stock Policy report
- The Stock Policies setting contains minimum and maximum start-of-period stock levels for each Item, expressed as a number of days' sales. This step in the calculation formula uses that setting and the sales forecast figures to calculate the quantity of each Item that you should have in stock at the beginning of each week or month. When you produce the report or run the Maintenance function, you will be able to specify whether this calculation will use the minimum or maximum stock level in the setting. Please refer to the Stock Policy - Average Sales per Day page for details about this calculation.
- Steps 3-6
- When you produce the report or run the Maintenance function, you might not know the exact stock level of each Item at the beginning of the period, probably because you are producing the report or running the Maintenance function ahead of time. You will therefore need to specify the date when you know the stock figures to be accurate (the "Date of Real Stock Level"). If the Date of Real Stock Level is earlier than the beginning of the period, the calculation formula will estimate stock levels on that date using the relevant Sales Forecast, Production and Purchase Order Plan figures. Steps 3-6 represent this part of the calculation.
- For example, the report period begins on January 1st, and you know that stock level figures are correct on the date when you are running the report, the previous November 30. Enter this date as the Date of Real Stock Level in the report specification window. The report will estimate stock levels for January 1st, displaying the calculation in sections 3-6 as follows:
- Step 3: Forecast
- Estimated sales figures for November 30 -December 31, calculated using the Sales Forecast records for November and December.
- Step 4: PO Plan
- Estimated goods-in figures for November 30 -December 31, calculated using the Purchase Order Plan records for November and December.
- Step 5: Prod Plan
- Estimated production figures for November 30 -December 31, calculated using the Production Plan records for November and December.
- Step 6: Forecast plus Production and Purchase Plan
- Step 3 - Step 4 - Step 5 (i.e. the net change in stock levels for the period November 30 -December 31).
- When you produce the report or run the Maintenance function, you might not know the exact stock level of each Item at the beginning of the period, probably because you are producing the report or running the Maintenance function ahead of time. You will therefore need to specify the date when you know the stock figures to be accurate (the "Date of Real Stock Level"). If the Date of Real Stock Level is earlier than the beginning of the period, the calculation formula will estimate stock levels on that date using the relevant Sales Forecast, Production and Purchase Order Plan figures. Steps 3-6 represent this part of the calculation.
- Step 7: Current Stock
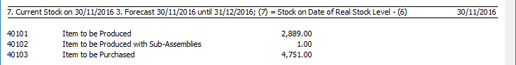
- The actual or calculated stock level of each Item at the beginning of the report period. This is calculated as the stock level on the Date of Real Stock Level less the figure in Step 6.
- The actual or calculated stock level of each Item at the beginning of the report period. This is calculated as the stock level on the Date of Real Stock Level less the figure in Step 6.
- With the Raw Materials needed from the Production Plan appended
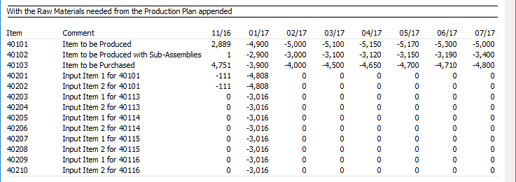
- If you have already created Production Plans and marked them as OK, this section will bring the raw materials (components) in those Production Plans into the report, showing the quantities to be purchased in order to satisfy the Production Plans.
- For a component to appear in this section, it must be included in the Recipe used in a Production Plan row in which the Start Date falls in the report period. The Start Date in a Production Plan row is likely to fall in an earlier period than the Production Plan as a whole. You should therefore take this into account when specifying a period for the Purchase Order Plan Preview report and the 'Create Purchase Orders' Maintenance function. It is likely that after creating a Production Plan for a particular week or month, you will need to create a Purchase Order Plan for a few earlier weeks or months (depending on lead times and production times). For example, referring to the illustration above, we have created a Production Plan for February, but need to create a Purchase Order Plan for the previous January to capture the components. Please refer to the Dates and Workflow page for more details.
- The first column will display the stock level of each Item at the beginning of the report period (from Step 7), using positive figures. The remaining columns will display Sales Forecast figures (saleable Items) and purchasing requirements (components), using negative figures.
- If you have already created Production Plans and marked them as OK, this section will bring the raw materials (components) in those Production Plans into the report, showing the quantities to be purchased in order to satisfy the Production Plans.
- Step 8: With the Stock Level and Forecast Appended
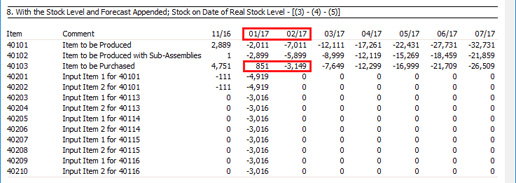
- This step calculates the stock level at the end of each week or month by subtracting the Sales Forecast for that week or month from the stock level at the beginning of that week or month. In other words, it is the quantity that needs to be purchased to satisfy the Sales Forecast.
- In the example illustrated above, the figure for January for Item 40103 is 851 (i.e. the stock level at the beginning of the report period (4751 from Step 7) less the Sales Forecast (3900)). The February calculation begins with the 851 figure (stock level at the end of January) and subtracts the February sales forecast of 4000, producing -3149. This is shown as a negative figure, indicating that the Sales Forecast figure cannot be met from stock.
- This step calculates the stock level at the end of each week or month by subtracting the Sales Forecast for that week or month from the stock level at the beginning of that week or month. In other words, it is the quantity that needs to be purchased to satisfy the Sales Forecast.
- Step 11: Minus: Forecast of this month, resulting in:
- Step 11 is not shown in the report but it is part of the calculation. It calculates the quantity of each Item that you need to purchase to meet both the Sales Forecast for the week or month and the Stock Policy requirement for the next week or month. It subtracts the Stock Policy requirement for the next week or month from the Step 8 figure for the week or month.
- If this figure is negative, this indicates that the Sales Forecast and the Stock Policy requirement for the next week or month can be met from stock and therefore there is no purchase requirement. The Item will then not be included in the Purchase Order Plan for the week or month by the 'Create Purchase Order Plan' Maintenance function.
- If this figure is negative, this indicates that the Sales Forecast and the Stock Policy requirement for the next week or month can be met from stock and therefore there is no purchase requirement. The Item will then not be included in the Purchase Order Plan for the week or month by the 'Create Purchase Order Plan' Maintenance function.
- Step 12: With the Purchase Plan Appended
- If you have already created and marked as OK a Purchase Order Plan for a week or month, this step will subtract the quantities in that Purchase Order Plan from the figures in Step 11.
- This suggests that running the 'Create Purchase Order Plan' Maintenance function again will create a second Purchase Order Plan for the same Items for the week or month in question, effectively creating a supplement to the original Purchase Order Plan. In fact the Maintenance function will mark the original Purchase Order Plan as Closed and will create a new Purchase Order Plan for the entire requirement (providing no Purchase Orders have been created from the original Purchase Order Plan: if they have, the Maintenance function will do nothing).
- If you have already created and marked as OK a Purchase Order Plan for a week or month, this step will subtract the quantities in that Purchase Order Plan from the figures in Step 11.
- Step 13. With the Production Plan Appended
- If you have already created and marked as OK a Production Plan for a week or month, this step will subtract the quantities in that Production Plan from the figures in Step 12.
- The existence of a Production Plan will not affect the quantities in a Purchase Order Plan. The detailed version of the Create Purchase Order Plan - Preview report includes all Items in Sales Forecasts (those that will be produced and those that will be purchased). The existence of a Production Plan will affect Items that will be produced, but these Items will not be included in Purchase Order Plans.
- If you have already created and marked as OK a Production Plan for a week or month, this step will subtract the quantities in that Production Plan from the figures in Step 12.
- Section 14: But first appending assumed correct monthly plans
- Steps 8-13 in the report will display accumulated figures from period to period (i.e. from column to column). These figures are the accumulated effect on stock levels of the Sales Forecasts and the Stock Policy requirements.
- Step 14 separates the accumulated figures into individual weekly or monthly production and purchasing requirements. Negative figures in Step 13 will be set to zero: negative figures indicate requirements that can be satisfied from stock or from existing Production or Purchase Order Plans. Where the quantity is zero, the 'Create Purchase Order Plan' Maintenance function will not include the Item in the Purchase Order Plan for the week or month.
- Steps 8-13 in the report will display accumulated figures from period to period (i.e. from column to column). These figures are the accumulated effect on stock levels of the Sales Forecasts and the Stock Policy requirements.
- After existing Purchase Orders
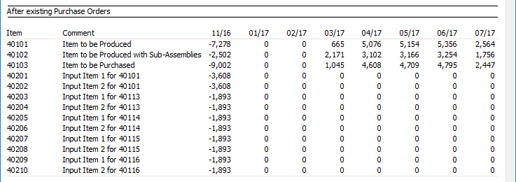
- If there are already any Purchase Orders with Planned Delivery Dates that fall in a particular week or month, this step will subtract the quantities in those Purchase Orders from the Step14 figures.
- For a Purchase Order to be included in the calculations in this step, it must have a Planned Delivery Date and this must use the Date format, set in the Planned Delivery setting in the Sales Orders module. The Purchase Order does not have to be marked as OK, but it must not be Closed.
- If there are already any Purchase Orders with Planned Delivery Dates that fall in a particular week or month, this step will subtract the quantities in those Purchase Orders from the Step14 figures.
- Step 15: Final Results
- This step shows the quantity of each Item that you need to produce.
- While the previous steps were calculated for every Item in Sales Forecasts, this step will isolate those that can be purchased (i.e. those that do not have Recipes) from those that can be produced.
- This step shows the quantity of each Item that you need to produce.
The Calculation Formula in the MRP module:
- Introduction
- The Production Plan Formula
- The Purchase Order Plan Formula
- Stock Policy - Average Sales per Day
- Dates and Workflow
- Start Dates in Production Plans
- Order Dates in Purchase Order Plans
- Home page for MRP manual
- Home page for Standard ERP manual
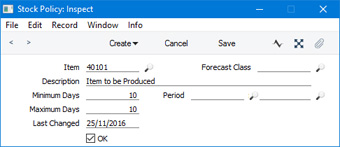
Stock Policy - Average Sales per Day
When the production and purchasing requirements for a particular week or month are calculated, one element in the calculation will be the number of units that should be in stock at the beginning of the next week or month. This figure will be calculated using the information in the Stock Policies setting and the Sales Forecast figures. The Stock Policies setting is where you should specify what the stock level for each Item should be at the end of each week or month and the beginning of the next, expressed as a number of days' sales. You can specify minimum and maximum figures.In the example illustrated below, we have specified that we want to keep ten days' sales in stock:
When calculating the production and purchasing requirements for a particular week or month, you will be able to choose whether to use the minimum or the maximum stock level, or to ignore the Stock Policy setting. If you choose to ignore the Stock Policy setting, it will be assumed that the stock level at the end of a week or month should be the full Sales Forecast figure for the next week or month.
In the Stock Policies setting, the required stock level for each Item is expressed as a number of days' sales. Calculating the quantity you will sell in one day requires the following information:
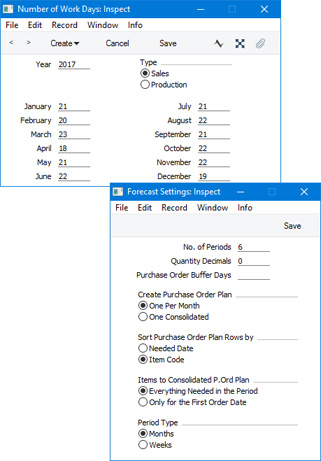
- The No. of Periods field in the Forecast Settings setting should contain the number of weeks or months that you want to be used in the calculation.
- Sales Forecasts for the Item for at least this number of weeks or months ahead of the week or month in question.
- If your Period Type is "Months", the No. of Work Days setting should contain the number of sales days in each month. If your Period Type is "Weeks", the Bank Holidays for Sales Forecast setting should contain the number of sales days in each week.
Forecast Month 1 + Forecast Month 2 + ... Forecast Month n Days in Month 1 + Days in Month 2 + ... Days in Month n
In our example, we need to keep sufficient stock for ten days' sales. Using the Sales Forecast figures that were illustrated in Step 1 on the Production Plan Formula page and the No. of Work Days in the illustration above, the estimated sales per day for Item 40101 at the beginning of March will be calculated as follows:
5100 + 5150 +5170 + 5300 + 5000 + 5100 23 + 18 + 21 + 22+ 21 + 22
A large No. of Periods figure will result in an average sales per day figure that gradually changes if there are seasonal variations in sales. However, if you specify a large No. of Periods figure, you will need to ensure that you have Sales Forecasts for at least that number of weeks or months ahead of your reporting periods, to maintain accuracy in the calculation. For example, if a preview report or Maintenance function covers the period from March to August, the No. of Periods is six and the Period Type is "Monthly", this requires you to enter Sales Forecasts until the next February, six months ahead of August. The No. of Work Days setting should also have entries at least until the next February. If you only have Sales Forecasts until December, the average sales per day figure will not be correct because it will be calculated by dividing four months' Sales Forecast figures by six months' sales days.
---
The Calculation Formula in the MRP module:
- Introduction
- The Production Plan Formula
- The Purchase Order Plan Formula
- Stock Policy - Average Sales per Day
- Dates and Workflow
- Start Dates in Production Plans
- Order Dates in Purchase Order Plans
- Home page for MRP manual
- Home page for Standard ERP manual
Dates and Workflow
This page describes how to schedule Production Plans and Purchase Order Plans when you create them from Sales Forecasts.- A Sales Forecast should be for one week or one month (depending on the Period Type you have chosen in the Forecast Settings setting), and should begin on the first day of the week (i.e. Monday) or the month.
- When you create a Production Plan from a Sales Forecast (i.e. using the 'Create Production Plan' Maintenance function), its period will be the same as the period of the Sales Forecast. In each row in the Production Plan, the Needed Date will be the first day of the week or month, so that the Items will be in stock ready to sell during the week or month. This means that the Start Date in each row (i.e. the date when production work should start) is likely to be in an earlier week or month. Please refer to the Start Dates in Production Plans page for details about how Start Dates will be calculated.
- The 'Create Purchase Order Plan' Maintenance function will create a Purchase Order Plan that includes both the buyable Items in the Sales Forecast and the Items that are required as components in the Production Plan. When you specify a period for this Maintenance function, bear in mind the following:
- An Item in a Sales Forecast will be included in the Purchase Order Plan if the Start Date of the Sales Forecast is within the period that you specify.
- An Item required by a Recipe in a Production Plan (i.e. a component) will be included in the Purchase Order Plan if the Start Date in the Production Plan row is within the period that you specify.
As mentioned in step 2, the Start Date in a Production Plan row is likely to fall in an earlier period than the Production Plan as a whole. You should therefore take this into account when creating Purchase Order Plans.
For example, if you create a Production Plan for March, the Start Dates in each row (i.e. the dates when you need to start work on the suggested Productions) are likely to be in February (or earlier). You will therefore need to run the 'Create Purchase Order Plan' function for February and possibly earlier months (to ensure the components will be ordered). Items for resale in February's Sales Forecast will also be included in the Purchase Order Plan. When you create a Production Plan for April, you should then create a Purchase Order Plan for March, and so on. This in turn means you should create the Production Plan well in advance, so that there is sufficient time for the ordered components to arrive and for the production work to be carried out.
- An Item in a Sales Forecast will be included in the Purchase Order Plan if the Start Date of the Sales Forecast is within the period that you specify.
The Calculation Formula in the MRP module:
- Introduction
- The Production Plan Formula
- The Purchase Order Plan Formula
- Stock Policy - Average Sales per Day
- Dates and Workflow
- Start Dates in Production Plans
- Order Dates in Purchase Order Plans
- Home page for MRP manual
- Home page for Standard ERP manual
Start Dates in Production Plans
When you create a Production Plan, each Item will be given a Needed Date. In the case of a Production Plan that you create from a Sales Forecast (i.e. using the 'Create Production Plan' Maintenance function), the Needed Date for each Item will be the first day of the Sales Forecast period (i.e. the first day of a week or month), so that the Items will be in stock ready to sell during the week or month. Each Item will also be given a Start Date. The Start Date is the date when production work should begin in order for work to be complete on the Needed Date. This section describes how Start Dates will be calculated.The calculation of the Start Date in a Production Plan row requires some or all of the following information:
- Fixed Assembly Days, Time to Setup, Days/Hours/Minutes/Seconds to Produce and Number Produced in the Recipe. In more detail, these fields are as follows:
- Days to Produce
- The number of days required to build a single application of the Recipe (i.e. the number of days required to build the Out Qty). One day is 24 hours.
- Hours/Minutes/Seconds to Produce
- The number of hours/minutes/seconds required to build a single application of the Recipe.
- If you specify any combination of Days, Hours, Minutes and Seconds, they will be added together.
- If you specify any combination of Days, Hours, Minutes and Seconds, they will be added together.
- Fixed Assembly Days
- This is a constant figure irrespective of the quantity being built (i.e. it is for work that is carried out once per production run, and so will be the same irrespective of the number of applications of the Recipe). Again, one day is 24 hours.
- Time to Setup
- This is a constant figure irrespective of the quantity being built (i.e. it is for work that is carried out once per production run, and so will be the same irrespective of the number of applications of the Recipe).
- This field uses a time format. For example, if the Time to Setup is two hours, enter "02:00:00". The maximum time is 23:59:59.
- This field uses a time format. For example, if the Time to Setup is two hours, enter "02:00:00". The maximum time is 23:59:59.
- Number Produced
- The Time to Setup, the Days, Hours, Minutes and Seconds to Produce and the Fixed Assembly Days fields above usually refer to one application of the Recipe i.e. they are the times required to produce the Out Qty of the Output Item. If this is not the case, enter the number of applications of the Recipe to which these times refer.
- Days to Produce
- Buffer Days in the Production Settings setting in the Production module.
- A record in the Production Item Alternatives register connecting the Recipe to a Machine.
- A record in the Machine Hours register for the Machine Group to which the Machine belongs.
- The first stage is to calculate the time required to build the five units, using the information in the Recipe, for example:
Days to Produce (1 day each, from Recipe) 5 Hours to Produce (12 hours each, from Recipe) 2.5 Fixed Assembly Days (from Recipe) 2 Total 9.5
Days to Produce (1 day each, from Recipe)/Number Produced 2.5 Hours to Produce (12 hours each, from Recipe)/No. Produced 1.25 Fixed Assembly Days (from Recipe) 2 Total 5.75
- If the Recipe includes a Time to Setup and/or a Hours/Minutes/Seconds to Produce, and their overall contribution to the calculation is not a whole number of days, the decimal part can be rounded up to one day providing it is greater than one hour. This rounding up will occur if you are using the Round odd Hours to One Day option in the Production Settings setting. Otherwise, the decimal part will be truncated. In this example, the Hours to Produce will be rounded up by the Round odd Hours to One Day option:
Days to Produce (1 day each, from Recipe)/Number Produced 2.5 Hours to Produce (12 hours each, from Recipe)/No. Produced 2 Fixed Assembly Days (from Recipe) 2 Total 6.5
- It will therefore require 6.5 days to produce the five units. This means 6.5 24-hour days, or 156 hours. The next step is to check the working hours of the Machine that will be used to produce the Item.
The Machine will be established from the Production Item Alternatives record for the Item, as follows:
- The Machine will be the Default Machine specified in the header of the Production Item Alternatives record.
- If there is no Default Machine in the Production Item Alternatives record, the Machine will be taken from the first row in which the Default Recipe is the Recipe in the Item record.
The working hours of the Machine will be taken from the record in the Machine Hours register for the Machine Group to which the Machine belongs.
For example, if the Machine works for eight hours, Monday-Friday, the 156 hours will require 29 calendar days (the calculation will be rounded up to the nearest whole day).
If there is no record for the Item in the Production Item Alternatives register, or no record for the Machine Group in the Machine Hours register, it will be assumed that the working day for production work is 24 hours.
- The Machine will be the Default Machine specified in the header of the Production Item Alternatives record.
- The final part of the calculation will add in the Buffer Days from the Production Settings setting:
Total from previous step 29 Buffer Days (from Production Settings) 3 Total 32
- The Start Date will therefore be 32 days before the Needed Date, September 30.
The Calculation Formula in the MRP module:
- Introduction
- The Production Plan Formula
- The Purchase Order Plan Formula
- Stock Policy - Average Sales per Day
- Dates and Workflow
- Start Dates in Production Plans
- Order Dates in Purchase Order Plans
- Home page for MRP manual
- Home page for Standard ERP manual
Order Dates in Purchase Order Plans
When you create a Purchase Order Plan, each Item will be given a Needed Date. In the case of a Purchase Order Plan that you create from a Sales Forecast (i.e. using the 'Create Purchase Order Plan' Maintenance function), the Needed Date for each Item will be the first day of the Sales Forecast period (i.e. the first day of a week or month), so that the Items will be in stock ready to sell during the week or month. Each Item will also be given an Order Date. The Order Date is the date when a Purchase Order should be issued in order for the Item to arrive on the Needed Date. This section describes how Order Dates will be calculated.The calculation of the Order Date in a Purchase Order Plan row usually requires there to be a Default Purchase Item for the Item in question (but if you have specified a Supplier in the header of a Purchase Order Plan or in an individual row, the Purchase Item does not have to be marked as Default). If you have specified a Delivery Days (i.e. the number of days needed for the Supplier to deliver the Item) in the Purchase Item, this figure will be copied to the Del. Days field in the Purchase Order Plan row and will be used to calculate the Order Date (Order Date = Needed Date - Del. Days).
A Purchase Order Plan created by the 'Create Purchase Order Plan' Maintenance function may contain many Items that need to be ordered within a few days of each other (usually these will be components required by Production Plans). The result can be many Purchase Orders, some of which only contain a few Items.
If you would like these Items to be amalgamated in a single Purchase Order (providing they will be ordered from the same Supplier), you can specify a number of Buffer Days in the Forecast Settings setting. Items to be ordered within that number of days will be given the same Order Date in the Purchase Order Plan.
If you specify a number of Buffer Days, the 'Create Purchase Order Plan' Maintenance function will sort the Items to be ordered by Order Date. It will then add the number of Buffer Days to the earliest Order Date and find the other Items that need to be ordered within that number of Buffer Days. These Items will all be given the same Order Date. It will then add the number of Buffer Days to the earliest Order Date in the remaining Items and repeat the process.
For example, a Purchase Order Plan will contain Items with the following Order Dates if the number of Buffer Days is 0:
- 13 October
- 16 October
- 17 October
- 19 October
- 20 October
- 16 October
If you have set the number of Buffer Days to 5, the Order Dates in the Purchase Order Plan will be set as follows:
- 13 October
- 13 October (original date 16 October is within five days of 13 October)
- 13 October (original date 16 October is within five days of 13 October)
- 19 October (19 October is not within five days of 13 October, so this date isn't changed)
- 19 October (original date 20 October is within five days of 19 October)
- 13 October (original date 16 October is within five days of 13 October)
If you have set the number of Buffer Days to 6, the Order Dates in the Purchase Order Plan will be set as follows:
- 13 October
- 13 October
- 13 October
- 13 October
- 20 October
- 13 October
---
The Calculation Formula in the MRP module:
- Introduction
- The Production Plan Formula
- The Purchase Order Plan Formula
- Stock Policy - Average Sales per Day
- Dates and Workflow
- Start Dates in Production Plans
- Order Dates in Purchase Order Plans
- Home page for MRP manual
- Home page for Standard ERP manual